Slowdown: Adelaide’s traffic grind revealed in new official data
EXCLUSIVE: Adelaide traffic is steadily slowing as vehicle volumes increase, according to official monitoring of key city road routes going back to the late 1990s.

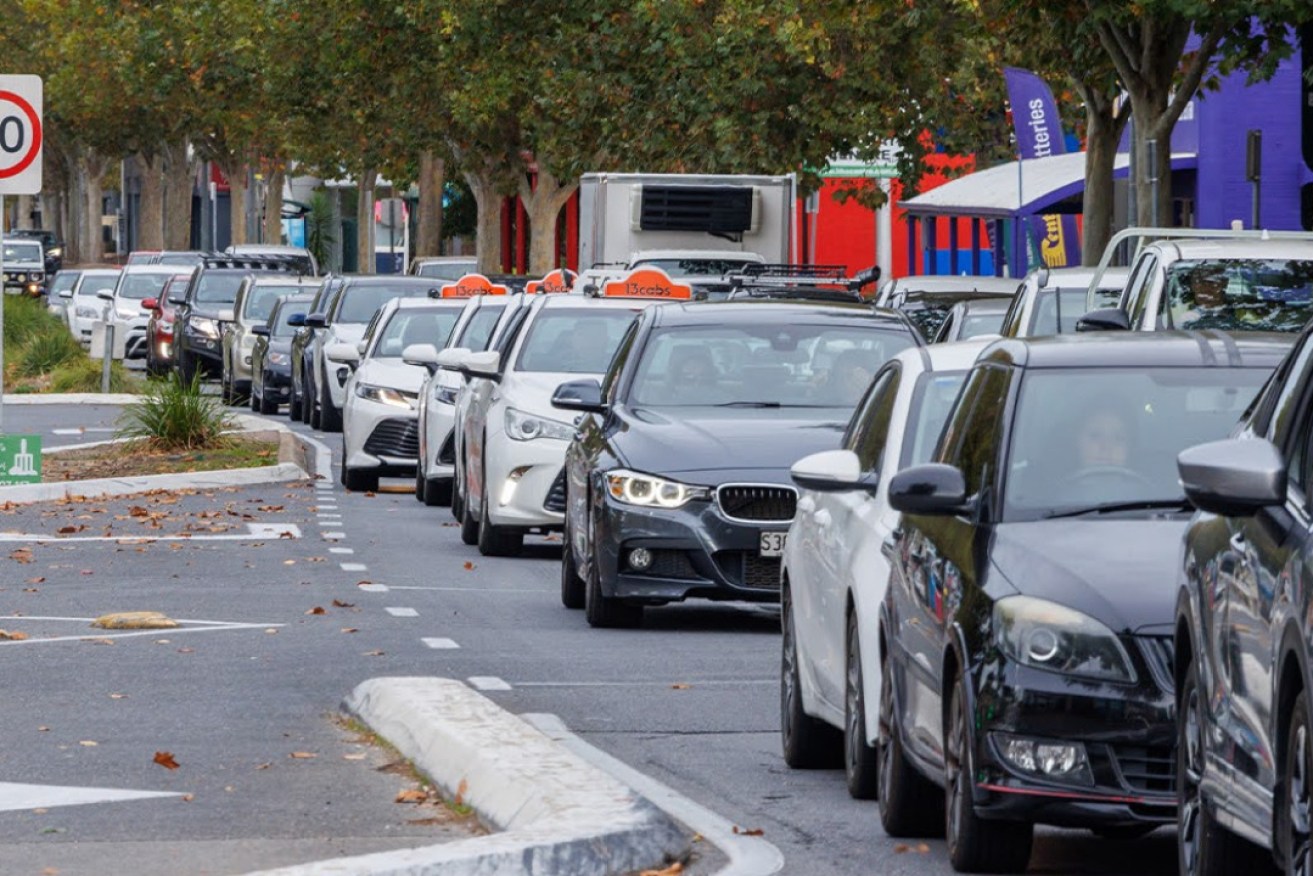
Photo: Tony Lewis/InDaily
Speeds on key commuter routes in Adelaide have been heading steadily downwards over the past decade, with only COVID lockdowns and its resulting working-from-home trend providing relief.
Department for Infrastructure and Transport survey data going back to 1997/98, compiled at the request of InDaily, provides context for broader data that indicates a surprising truth – that Adelaide is one of the most congested cities in Australia.
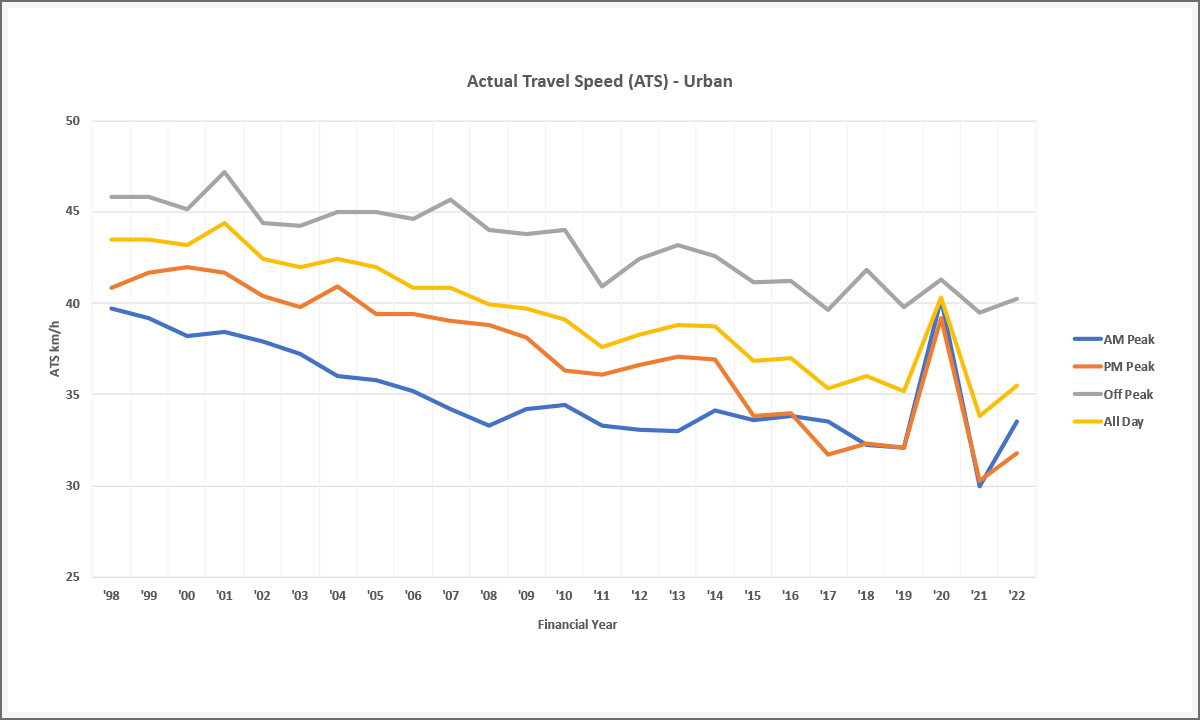
DIT says the data (see graph below) shows there has been a “general decline” in travel speed in metropolitan Adelaide over the past decade.
Looking back further to the turn of the century shows Adelaide commuters are travelling at considerably lower speeds on average.
When the first survey was taken in 1997/98, average speed across the day was 43.5km/h. In the latest survey, taken in the 2021/22 financial year, that figure had dropped to 35.5km/h – an 18 per cent speed reduction.
Even factoring in the pandemic-induced reduction in peak traffic, seen most dramatically in the 2019/20 data, the past decade has seen a continuation of the slowdown across most of the day.
The PM peak is the slowest period. In 1997/98, the survey registered an average PM peak speed of 40.8km/h. In the latest survey, that had dropped to 31.8km/h. A decade ago, that figure was 36.6km/h.
The AM peak has fared better: 39.7km/h in the 1997/98 financial year, 33.1km/h in 2011/12 and 33.5km/h in 2021/22.
The all-day average has dropped by 8km/h over the survey’s life. Over the past 10 years, the figure dropped by 3.2km/h.
The gap between off-peak speeds and the slowest peak period has widened: in the first survey the gap between the off-peak figure and the slowest time of the day – the AM peak – was 6.1km/h.
By 2021/22, the gap between the off-peak average and the slowest period – now the PM peak – was 8.4km/h.
DIT attributes the slowdown to a steady increase in vehicles on the road.
“The Department estimates that these numbers have grown in the Adelaide metropolitan area by an average of approximately 1 per cent per year over the past 10 years,” it said in a statement.
“During the COVID-19 pandemic, a significant improvement in travel speeds can be seen due to decreased mobility in the community and more people working from home.”
Whether that improvement will continue is unknown, with 2022/23 survey data yet to be analysed.
The data has been collected by the Department for more than 20 years to inform planning and monitor the performance of the network.
It’s gathered via a car travelling along the same set of road corridors at the same time of day, each year.
The surveyed roads (see map below) are primarily 60km/h roads in the inner to middle part of Greater Adelaide. It only includes a small 2km section of one of the “non-stop corridors” of the road network at Darlington.

The routes surveyed by the Department for Infrastructure and Transport since the late 1990s. Image supplied by DIT
This data and broader surveys show Adelaide has developed traffic congestion out of step with its size, compared with other cities.
A pre-pandemic 2018 study by the Australian Automobile Association found Adelaide was the second most congested city in Australia, behind Melbourne, and recorded the lowest average traffic speeds of all capital cities.
A benchmarking exercise commissioned by groups including the Committee for Adelaide found this year that the South Australian capital was going backwards in relation to traffic congestion, when ranked alongside 19 comparable cities.
“Adelaide is the only city where the number of hours lost to traffic congestion has increased since 2019, a 16 per cent increase versus a 27 per cent fall among 14 peers,” the report found.
A report by company TomTom found Adelaide had the third slowest average travel times per 10km – only Sydney and Melbourne had worse performances.
DIT says it is addressing congestion through measures including intersection improvements, grade separation of trams and trains, and SA’s biggest-ever road project – the River Torrens to Darlington project.
“The Department continues to prioritise projects that address network congestion, with the completion of a number of major road projects around Adelaide in recent years improving average travel speeds on some sections of arterial roads,” it said.
Jennifer Bonham, a UniSA researcher who focuses on sustainable transport, said building more road capacity was not a long-term solution and was likely to be counter-productive.
“Aside from the impact it has on the local environment, the use of other modes and the severance it creates, there is of course induced demand,” Bonham said.
Induced demand is an economic theory that links increased supply to increased consumption.
Bonham cited a 2022 academic article showing that increased road capacity not only leads to an increase in the amount of traffic across the entire network, but also speeds up the rate of traffic increase.
“If DIT is blaming the slower speeds on an increase in vehicles then they really need to ask why there is an ongoing increase in vehicles on the roads,” she said. “We have some population increase but that doesn’t automatically translate to motor vehicle use.
“The significant growth in Light Commercial Vehicles (40 per cent nationally over the past decade according to BITRE 2023 data) doing deliveries is probably one of the biggest factors in more vehicles on the roads.
“Road investments over the past decade have increased road capacity which makes driving more attractive in the short term and (according to the article I referred to above) translates to an overall increase in traffic on the network. ”
The RAA had a different view, with its senior manager safety and infrastructure, Charles Mountain, arguing the development of the road network needs to keep up with our population growth.
“The travel time data reflects the need to continue to invest in Adelaide’s metropolitan road network to keep pace with population growth, so Adelaide can maintain its status as one of the world’s most liveable cities,” he said.
“RAA is supportive of the North-South Corridor project, which should have a significant positive impact on travel times once complete.
“RAA has previously advocated for upgrades to east-west links in the northern suburbs to reduce growing congestion due to nearby housing developments.”
While DIT emphasised that public transport was an important contributor to addressing congestion, Bonham said the Department had been “very slow to encourage people back onto public transport since COVID”.
“We will probably need to get innovative about parcel deliveries – some interesting smaller vehicle technologies including enhanced cargo bike delivery vehicles in Europe.
“Of course, there are many things we could do to reduce the private motor vehicle traffic component of the increase – but we need the political will to do it.”
Mountain also advocated for increased investment in public transport as well as active forms of transport like cycling and walking.
“RAA has also previously called for more investment in Adelaide’s public transport network to increase patronage – as well as more safe and connected cycling and walking paths – all of which would help take pressure off Adelaide’s road network,” he said.