Why decades of poor economic growth haven’t ruined SA’s standard of living
Despite South Australia’s relatively poor economic performance over the past quarter century, there are broader forces at play that ensure the state’s living standards haven’t fallen as far as expected. Economics commentator Richard Blandy explains.


Crowds at the Adelaide Fringe. While SA's economic performance has been poor, standards of living have held up. Photo: Tony Lewis/InDaily
The longest data series of state and territory economic outcomes published by the Australian Bureau of Statistics starts in 1990. Therefore, I have used 1990 as an unbiased base from which to compare growth rates between the states and territories.
The state with the slowest growing economy (Gross State Product) over the past 26 years has been Tasmania (1.9% p.a.), followed by South Australia (2.2% p.a.). The state with the fastest growing economy over the past 26 years has been Western Australia (4.7% p.a.), followed by Queensland (4.0% p.a.).
Australia’s average economic growth rate over the past 26 years, which includes the Global Financial Crisis, of course, was 3.1% p.a.
As can be seen in Table 1, below, there are great differences between the states and territories in the growth rates of their economies. The difference between the growth rate of the fastest growing state economy, Western Australia, and the slowest growing, Tasmania, is 74 per cent of the Australian average growth rate.
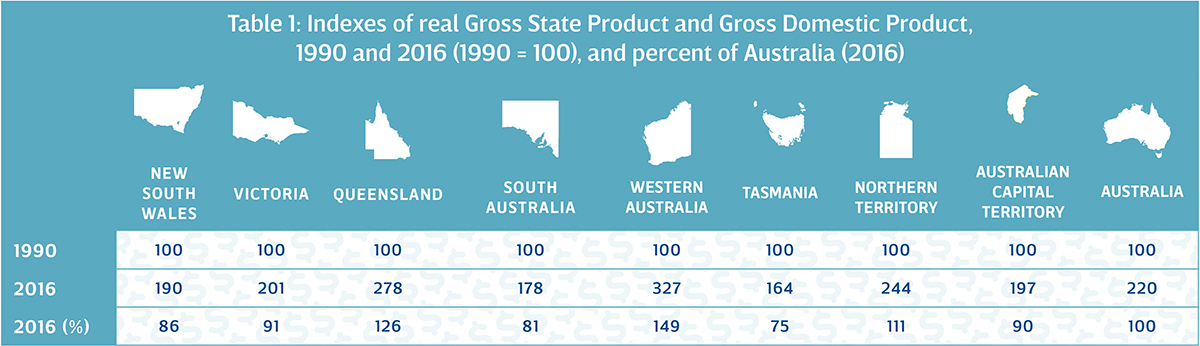
Source: Australian Bureau of Statistics, Cat. Nos. 5220.001 – 5220.020, Australian National Accounts: State Accounts, 2008-09, various tables
But, as we will see in Table 2, below, these differences in economic growth rates have not translated into growth in differences in household disposable incomes. Significant equilibrating forces have been at work, stopping household living standards in South Australia, for example, declining relative to Australia as a whole, and slowing the rise in household living standards in Queensland and Western Australia.
South Australians’ standard of living (as measured by average household disposable income per head) in 2016 was, in fact, $43,959 per annum – $108 per annum greater than Queenslanders’ average household disposable income per head, and only $3,310 per annum less than the Australian average. How can this be so?
I have lived in a lot of great places, and I know, like other South Australians, that Adelaide is just a fabulous place to live. The famous Australian historian, Geoffrey Blainey, once said that all South Australians living outside South Australia live in exile. But, like everyone else, I have felt worried about this situation being sustainable in the face of the state’s slow – by Australian standards – rate of economic growth.
This article is the first of several about why those worries turn out to be broadly misplaced. It is the start of a story about how our truly remarkable country evens-out differences in living standards among the states and territories, whatever the differences in economic growth rates among them may be – with one exception, Canberra.
While our children and grandchildren might not be able to remain close by, our economic future is likely to be rosier than our history of slow growth might imply.
As Table 2, below, shows, the lowest standard of living in 2016 (as measured by average household disposable income per head) was in Tasmania ($40,665), which is 14 per cent below the Australian average ($47,269). The highest, apart from the ACT, was in New South Wales ($50,806), which is only seven per cent above the Australian average. Hence, the range in average standards of living by State or Territory (Canberra aside) from lowest to highest was only $10,141 – 21 per cent of the Australian average.
The outlier is Canberra, where the average household disposable income per head in Canberra was $80,554 – 50 per cent above the Australian average!
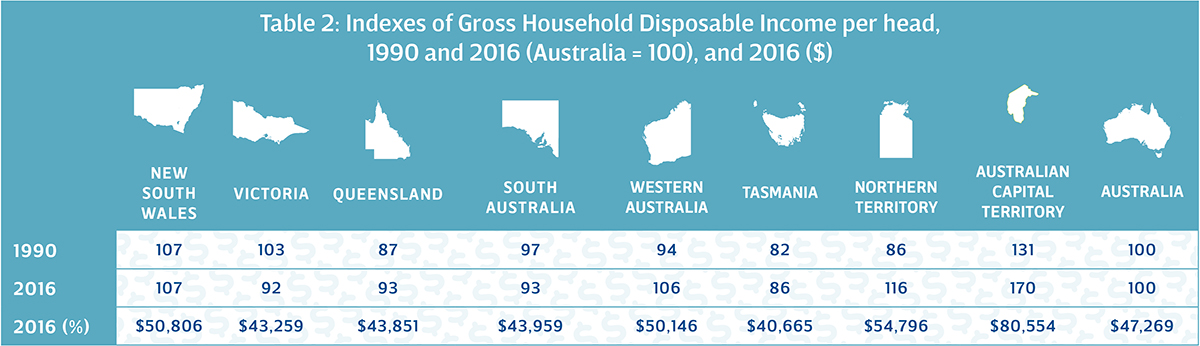
Source: Australian Bureau of Statistics, Cat. Nos. 5220.0, Australian National Accounts: State Accounts, 2016-17, various tables.
Further, the spread of household disposable incomes per head among the states and territories (Canberra apart) is now less than it was 26 years ago – ranging from Tasmania (25 per cent below the Australian average) to New South Wales (7 per cent above).
[Canberra’s households were already 31 per cent ahead of the Australian average in 1990 and have forged further ahead. Why is household disposable income per head in Canberra so far ahead of the rest of Australia?]
These figures are likely to surprise people, although they are consistent with economic theory, which predicts that in a country like Australia with low internal barriers to trade, migration and capital investment between the states and territories, incomes per head should converge towards a pattern that offsets the non-monetary disadvantages of living in particular locations.
On this reading, Tasmania must be generally reckoned by Australians to be the best (non-monetary) place to live, because Tasmania’s household disposable income per head is the lowest in Australia. Victoria, Queensland and South Australia are pretty good (non-monetary) places to live, too. But by and large, the Australian states and territories appear to be regarded as similar in their non-monetary advantages and disadvantages, because the spread in household disposable incomes among them is not great, Canberra apart.
On this reading, also, Canberra’s household disposable income is high because this is necessary to compensate people (at the margin) for the disadvantages of living in Canberra. Otherwise it would be easy to induce people to live in Canberra for less, and household incomes in the ACT would be less. An alternative explanation is that government employment dominates Canberra and the public sector unions have the Commonwealth Government over a barrel.
In many ways, the narrow range of outcomes in Table 1 (Canberra aside) is an amazing result, and testimony to the mobility and redistributive capabilities of the Australian economy.
The range of average household incomes (per head) among the states and territories is so low, in fact, that, speaking as a South Australian, moving interstate is worth only $3,310 in household disposable income per head, on average, which scarcely seems worthwhile, considering what one would have to give up – unless, of course, one were moving to Canberra, where the gain would be more than $36,000 annually.
One of the main factors reducing the correlation between faster economic growth and higher household incomes is population growth: people move to where jobs offering higher incomes can be found, and in so doing raise wages in the state or territory that they are leaving and reduce them in their destination. As can be seen in Table 3, below, there are significant differences between the states and territories in their population growth rates – differences which are strongly correlated with differences in GSP growth rates.
The faster that a state or territory’s economy grows, the faster its population grows as well. In fact, the correlation coefficient between economic and population growth in each state or territory is 0.96 (where a perfect correlation is 1.00), indicating that 93 per cent of a jurisdiction’s population growth can be predicted from its economic growth. The difference between the growth rate of the fastest growing state, Queensland, and the slowest growing, Tasmania, is 34 per cent of the Australian average growth rate. The effect of this is to reduce state and territory differences in growth rates of Gross State Product per head, compared with differences in growth rates in Gross State Product. This is shown in Table 4.

Source: Australian Bureau of Statistics, Cat. No. 3101.0, Australian Demographic Statistics, Table 4: Estimated Resident Population, States and Territories (number)
As can be seen in Table 4, below, while there are significant differences between the states and territories in growth rates of Gross State Product (as shown in Table 1, earlier), differences in rates of growth in Gross State Product per head over the past 26 years have been much less.
Tasmania has had the slowest growth, 13 percentage points below the Australian average, and Western Australia has had the fastest growth, 37 percentage points above the Australian average. The spread in GSP per head between fastest and slowest growing is 50 percentage points, less than the 72 percentage point spread between fastest and slowest growing among the states and territories in GSP itself.

Source: Compiled from tables 1 and 3, above
If one leaves Western Australia out (on the grounds that the minerals boom has ended and Western Australia’s economic growth has slowed), the spread among the states and territories in GSP per head in 2016 shrinks to only 20 percentage points.
Richard Blandy is an Adjunct Professor of Economics at the University of South Australia, an Emeritus Professor of Economics at Flinders University, and a regular contributor to InDaily.