Adelaide housing market surges on as national prices fall
House prices grew faster in Adelaide during May than in any other Australian capital city, bucking a trend that saw national property prices fall for the first time in 20 months.

According to CoreLogic data released this morning, Adelaide’s Home Value Index increased by 1.8 per cent in May to a median price of $628,744.
This equated to a 5.7 per cent increase in the past quarter and an annual change of 26.1 per cent.
Price increases in regional SA increased by 1.3 per cent for the month and 6.2 per cent for the quarter, also outpacing its interstate rivals.
The increases come despite the first interest rise in more than a decade at the start of May and contrast starkly with property price movements interstate.
The CoreLogic data shows Sydney house prices fell by 1 per cent in May while Melbourne values declined 0.7 per cent, which pushed the combined capitals index down 0.3 per cent over the month.
There was a 0.5 per cent rise in housing values across Australia’s combined regional areas in May but it was not enough to keep the national index on the positive side of the ledger – falling by 0.1 per cent.
This was the first monthly decline in the national index since September 2020.
While Sydney and Melbourne led the initial post-COVID boom in 2020, the index has been recording progressively larger monthly value declines since February, while Melbourne has fallen across four of the past six months.
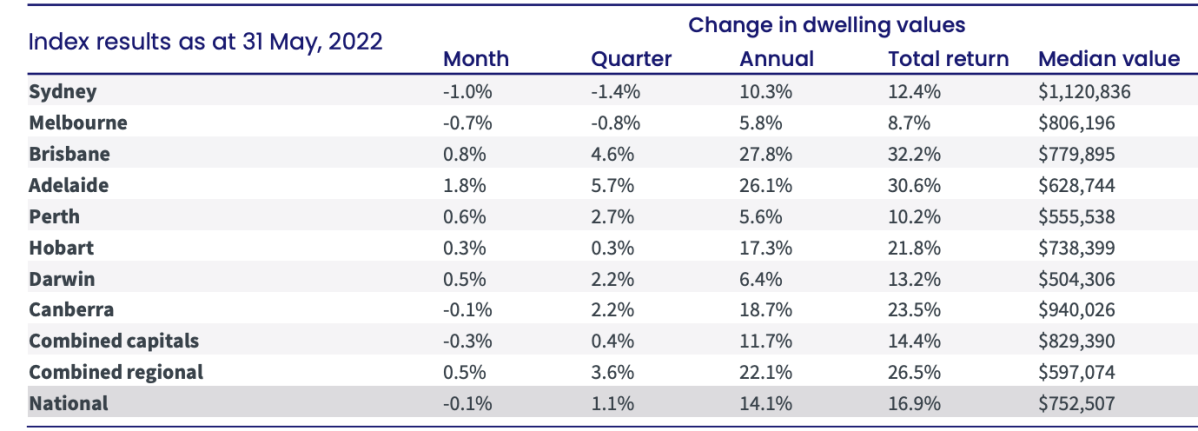
Image: CoreLogic
Since peaking in January, Sydney housing values are down 1.5 per cent but remain 22.7 per cent above pre-COVID levels. Comparatively, Melbourne, which experienced a softer growth phase, has recorded a smaller peak-to-date decline of 0.8 per cent with housing values now 9.8 per cent higher compared to the pre-COVID level.
Brisbane had challenged and often headed Adelaide for Australia’s fastest-growing capital city house prices in recent months before recording a 0.8 per cent price slump in May.
Perth (0.6 per cent), Darwin (0.5 per cent) and Hobart (0.3 per cent) were the other Australian capitals alongside Adelaide to record an increase in May.
CoreLogic’s Research Director Tim Lawless said housing market conditions had been weakening at a macro level over the past year.
“There’s been significant speculation around the impact of rising interest rates on the property market and last month’s increase to the cash rate is only one factor causing growth in housing prices to slow or reverse,” he said.
“Housing has been getting more unaffordable, households have become increasingly sensitive to higher interest rates as debt levels increased, savings have reduced and lending conditions have tightened.
“Now we are also seeing high inflation and a higher cost of debt flowing through to less housing demand.”
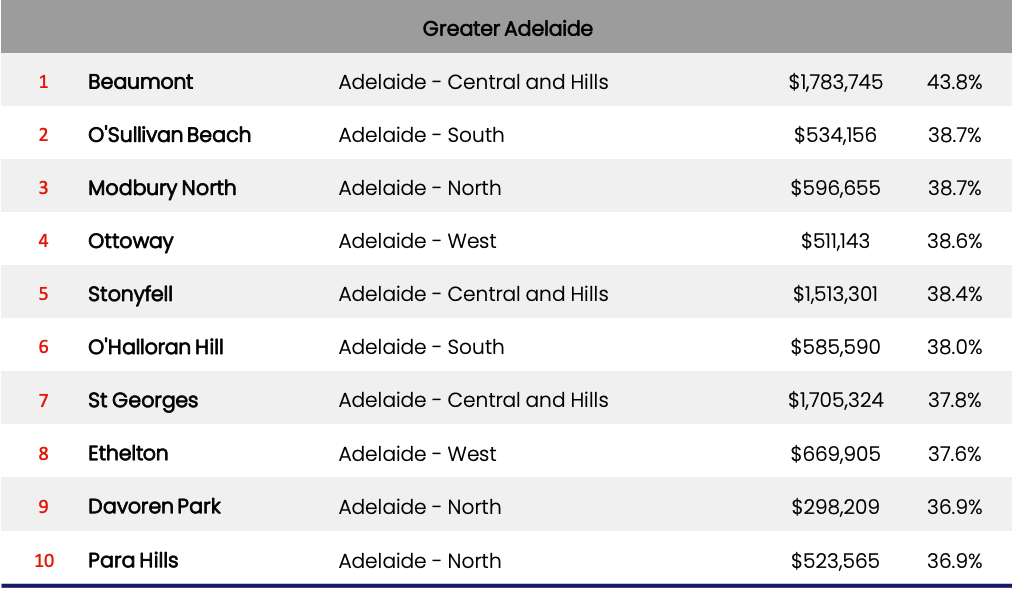
In Adelaide, the eastern suburb of Beaumont has had the highest growth in the past 12 months, increasing its median house price 43.8 per cent to $1,783,745.
In contrast, the fastest-growing locations in Greater Sydney and Greater Melbourne increased by 30.4 per cent and 22 per cent for the 12 months respectively to the end of May.
CoreLogic says the trend in advertised stock levels helps to explain the weaker conditions across Sydney and Melbourne.
Nationally, advertised stock levels remain 10.3 per cent below a year ago 28.4 per cent below the previous five-year average.
Not surprisingly, prices have remained strong in the cities where stock levels remain the lowest.
Adelaide’s advertised stock levels are still 39.5 per cent below the five-year average while Brisbane (-38.2 per cent) and Perth (-34.7 per cent) are also well down.
However, Sydney’s advertised listings are 5.1 per cent higher than 12 months ago and 1.5 per cent above the five-year average.
Similarly, Melbourne’s advertised stock levels are up 1.3 per cent on last year and 8.1 per cent above average based on the previous five years.
“With stock levels now higher than normal across Australia’s two largest cities, buyers are back in the driver’s seat,” Lawless said.
“Higher listings add to tougher selling conditions more broadly. Vendors in Sydney and Melbourne have faced lower auction clearance rates since mid-April and those selling via private treaty are taking longer to sell with higher rates of discounting.”