Adelaide’s CBD has the highest rate of housing stress in South Australia, an InDaily analysis has found.
More than a third of residents in the state suburb of Adelaide, which takes in the CBD and parklands, spend more than 30 per cent of household income on rent or mortgage.
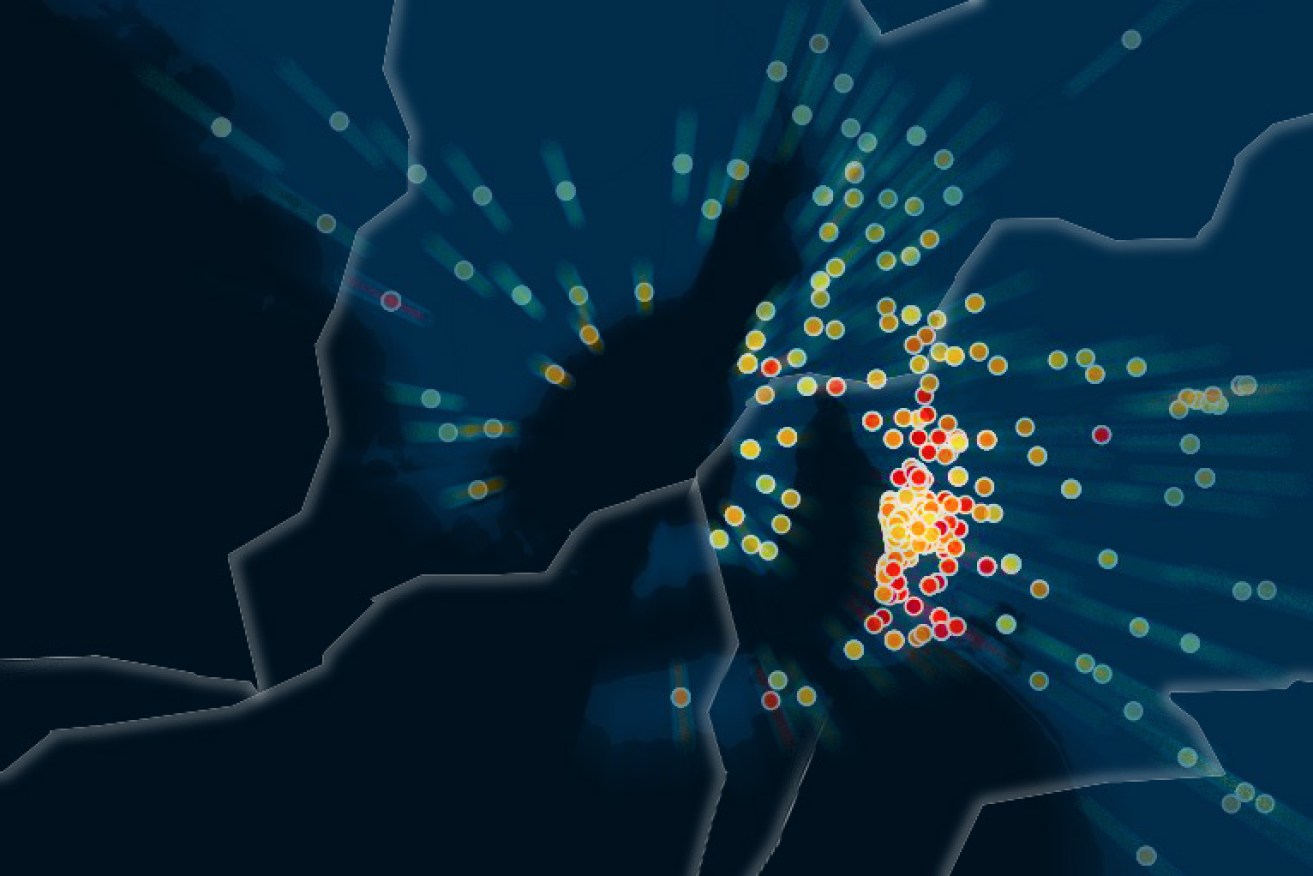
Discover your suburb using InDaily’s interactive map below.
InDaily used data from the latest Australian Bureau of Statistics census (2011) to rank South Australia’s 821 suburbs by housing stress, median weekly household income and population.
The results demonstrate the local impact of a wider housing affordability crisis in Australia.
Adelaide, as well as every other major housing market in Australia, was rated severly unaffordable by this year’s Demographia affordability survey.
No Australian housing market, large or small, was ranked affordable or even moderately unaffordable by the survey.
A federal senate inquiry into housing affordability is currently underway, and due to report its findings on November 27.
How to use the map
- Find your suburb by zooming in with your mouse scroll wheel.
- Click one of the coloured suburb dots.
- The redder the dot, the higher proportion of people in housing stress in that suburb.
A tale of two cities
‘It was the best of times, it was the worst of times…’
– Family First Senator Bob Day, in his submission to the senate inquiry into housing affordability.
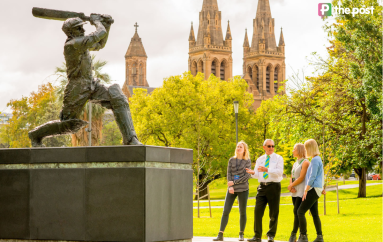
Day was right to apply the Dickensian allusion to the South Australian housing market, but it fits just as well for the City of Adelaide.
The square mile is home to some of South Australia’s richest and poorest people.
Overall, 33.7 per cent of those living in the CBD spend more than 30 per cent of their wage on housing. This demonstrates a weakness of the housing stress indicator – the very rich can easily afford to spend more than 30 cents in a dollar on housing, whereas the very poor cannot.
This weakness is sometimes avoided using the 30/40 rule, where only those earning in the bottom 40 per cent of the income scale spending over 30 per cent of their income on housing are considered to be in housing stress.
Many of the poorest city dwellers spend a vast proportion of their income on rent or mortgage.
According to Census figures, more than half of those on very low incomes – and more than a third of those on moderate incomes – in the Adelaide local government area* spend more than 50 per cent of household income on rent or mortgage.
“There is an alarming number of people living in housing stress,” Shelter SA director Alice Clark told InDaily.
“The lower your income, the less you have to spend on utilities, food, health care and other non-luxury items.”
Adelaide Lord Mayor Stephen Yarwood said figures on housing stress in the city could appear more dire than they were, because many city residents make a trade-off between high housing costs and lower general costs.
“Living in the city means you save a huge amount of costs in terms of transport: less bus tickets, less fuel, [and] a lot of people living in the city do not own a car,” he said.
“Fifty-one per cent of residents of the city of Adelaide walk to their place of employment.”
Yarwood said the 30 per cent of household income housing-stress indicator was less relevant for many city residents.
“Absolutely, the statistics indicate housing stress, but those figures used are calculated on a standard person’s household income requirements – 1.2 cars, a certain percentage for all these things.
“I get that numbers are numbers and I’m not going to be trying to diminish the numbers.”
Yarwood said that Adelaide City Council was going “above and beyond” its responsibilities when it came to housing affordability.
The council has a number of affordable housing projects to help alleviate the problem, including the reduced-price ERGO apartments in Sturt Street and the Common Ground apartments in Mellor Street.
SA’s top 10 suburbs in housing stress
- Adelaide – 33.7% in housing stress. Median weekly income: $949.
- Noarlunga Centre – 26.5% in housing stress. Median weekly income: $1,312.
- Western Flat – 24.6% in housing stress. Median weekly income: $771.
- Callington – 24.1% in housing stress. Median weekly income: $1,021.
- Kanmantoo – 21.9% in housing stress. Median weekly income: $1,359.
- Seaford Meadows – 21.4% in housing stress. Median weekly income: $1,331.
- Stockwell – 21.1% in housing stress. Median weekly income: $1,519.
- Lewiston – 19.9% in housing stress. Median weekly income: $1,348.
- Burton – 19.4% in housing stress. Median weekly income: $1,237.
- Forest Range – 19.4% in housing stress. Median weekly income: $1,537.
Further afield
Several of the suburbs with the highest rates of housing stress, including Callington and Kanmantoo, are just beyond the general commuting zone into Adelaide.
These areas are traditionally chosen for their low housing costs.
Demographer Graeme Hugo said the fact that significant housing stress existed in these communities indicated that parts of them were in severe poverty.
“Even though they’re going to these places with really low housing costs, their incomes are so low that they’re still under housing stress,” he said.
“That indicates how poor they are.”
Hugo said that in towns such as Stockwell, housing stress was being exacerbated by the fact that customers were rejecting the local shop.
“That place has really had a decline because the people in the area now shop in Adelaide rather than shop locally,” he said.
“So you’ve got high-income farmers in the rural areas, but in the township, [there’s] quite a significant poverty population.”
Housing stress in the most populated suburbs
- Mount Gambier – 6.8% in housing stress. Population: 24,905
- Morphett Vale – 11.3% in housing stress. Population: 22,602
- Paralowie – 15.6% in housing stress. Population: 15,872
- Parafield Gardens – 12.9% in housing stress. Population: 15,317
- Port Lincoln – 7.3% in housing stress. Population: 14,088
- Murray Bridge – 6.1% in housing stress. Population: 13,892
- Adelaide – 33.7% in housing stress. Population: 12,962
- Hallett Cove – 10.1% in housing stress. Population: 12,257
- Mount Barker – 10.5% in housing stress. Population: 11,809
- Happy Valley – 11.3% in housing stress. Population: 11,332
Improving housing affordability
Adelaide Benevolent Society president Robin Matters said the a charity was witnessing first-hand the high demand for affordable housing.
Tenants were secured in less than a week for the society’s six new low-cost dwellings at Ingle Farm – a $1.2 million development which officially opens today.
“Demand for affordable housing will only continue to rise as our population grows and living expenses increase at the rate they currently are,” Matters said.
In a bid to help those on low incomes access the housing market, the state government established the Affordable Homes Program in 2007.
As part of the program, Renewal SA negotiates with councils to make some properties exclusively available for purchase by low and moderate income buyers, for a limited period.
According to Renewal SA, more than 1400 new homes have been made available for affordable home ownership since the program was introduced.
Those who are unable to save enough for a home deposit with a traditional bank and earn under an income threshold can work with the state government’s HomeStart Finance instead.
HomeStart provides subsidised homeloans, accepts lower deposits, does not charge lenders’ mortgage insurance, and provides education and seminars on budgeting and saving.
Housing stress in the poorest suburbs** (as defined by median weekly income)
- Copley – 8.3% in housing stress. Median weekly income: $383
- Iron Knob – 6.3% in housing stress. Median weekly income: $487
- Blanchetown – 14.5% in housing stress. Median weekly income: $537
- Warooka – 8% in housing stress. Median weekly income: $540
- Peterborough – 6.7% in housing stress. Median weekly income: $540
- Moonta – 4.7% in housing stress. Median weekly income: $543
- Marion Bay – 6.3% in housing stress. Median weekly income: $547
- Terowie – 0% in housing stress. Median weekly income: $549
- Elizabeth South – 5.3% in housing stress. Median weekly income: $551
- Pinks Beach – 3.8% in housing stress. Median weekly income: $562
Housing stress in the richest suburbs
- Roxby Downs – 4.2% in housing stress. Median weekly income: $2,756
- Medindie – 12.9% in housing stress. Median weekly income: $2,592
- Springfield – 9.6 in housing stress. Median weekly income: $2,528
- Unley Park – 10% in housing stress. Median weekly income: $2,396
- Mount Osmond – 9.9% in housing stress. Median weekly income: $2,374
- Leigh Creek – 0% in housing stress. Median weekly income: $2,250
- Stonyfell – 10.4 in housing stress. Median weekly income: $2,250
- Medindie Gardens – 12.4% in housing stress. Median weekly income: $2,218
- Craigburn Farm – 14.6% in housing stress. Median weekly income: $2,217
- Chapel Hill – 7% in housing stress. Median weekly income: $2,107
Median weekly income figures quotes here are before tax. You can find out more about ABS income data collection in this fact sheet.
*The Adelaide local government area includes North Adelaide, whereas the Adelaide state suburb does not.
**Some suburbs have too few people for data to be available on housing stress.