Five charts that tell SA’s economic truth
Those deciphering South Australia’s economy need to be on their game to separate the substance from the spin. Richard Blandy writes of the readily available tool which will help anyone keep an eye on our economic performance.


People need unbiased and useful information if they are to form good judgements on what is happening. Otherwise, they are at the mercy of spin-doctors of one sort or another.
Every month the South Australian Labour Economics Office of the Commonwealth Government’s Department of Employment releases a South Australian Labour Market Brief.
It is only four pages long.
More than half the space is taken up by charts (and one table). Nearly all the charts show comparisons with the Australian economy as a whole.
This publication is one of the best summaries going around of what is really happening in the South Australian economy. It costs nothing and readers can subscribe by email.
The December issue shows on a large number of indicators how incredibly poorly the South Australian economy has been doing over the past few years in comparison with the Australian economy as a whole (not that the Australian economy’s performance has been all that flash).
Take employment, for example. The chart tells you everything you need to know. Over the past three years employment growth in South Australia has flatlined, whereas in Australia as a whole the growth figure is 5 per cent.
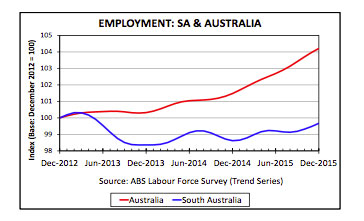
Image: South Australian Labour Market Brief
Even that does not tell the whole story, because it is only part-time employment that has grown.
Full time employment is 2 per cent less than it was three years ago (this is also shown in a chart).
Over the past 12 months, the table tells you that employment has grown by 1.1 per cent in South Australia and by 2.7 per cent in Australia as a whole, while the number of unemployed persons has risen by 8.2 per cent in South Australia and fallen by 4.8 per cent in Australia as a whole.
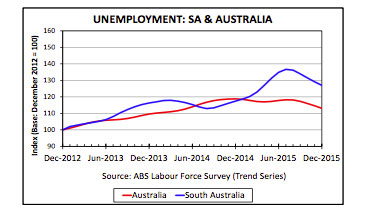
Image: South Australian Labour Market Brief
Comparisons in terms of youth unemployment rates are particularly distressing for South Australians.
Over the past three years, South Australia’s youth unemployment rate has steadily climbed by 1 per cent a year from 12 per cent to 15.5 per cent, whereas Australia’s started at 12 per cent, rose to 13.5 per cent and has now declined to 13 per cent.
The ANZ’s Job Advertisement Series (newspapers only) shows a declining trend both for Australia and South Australia (as job advertising shifts on-line), but the downward trend is much greater for South Australia since March 2014.
Internet vacancies for Australia and South Australia are also shown in a chart. This shows that Australian internet vacancies are 25 per cent below their base reading in 2006 while South Australian internet vacancies are 50 per cent below their 2006 base reading.
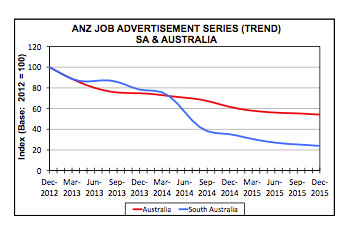
Image: South Australia Labour Market Brief
Two charts depict what has happened to production in Australia and South Australia since September 1995.
Since 2010 South Australia has averaged about 1.5 per cent p.a. growth, compared with about 2.5 per cent p.a. growth for Australia as a whole.
Particularly revealing are two charts of Building Activity in South Australia. The chart of Value of Building Work Done shows that the value of building work in South Australia in June 2015 was the same as in June 2009, while building approvals in South Australia in November 2015 are less than they were in early 2008.
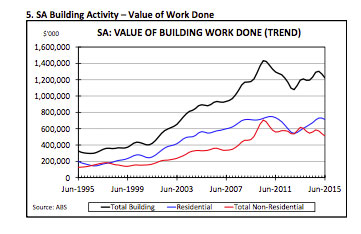
Image: South Australia Labour Market Brief
Finally, there is a chart of the engine of growth in all economies – Actual Private New Capital Expenditure.
This clearly shows that the upward trend in private sector investment in Australia as a whole accelerated from about 2011, reached a peak and has now fallen back to 2011 levels.
By contrast, growth in South Australia’s private sector investment decelerated from the middle of 2007, and is presently less than it was eight years ago.
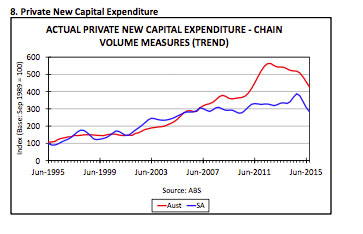
Image: South Australia Labour Market Brief
The SA Labour Market Brief also has highly informative charts of:
- Unemployment: SA and Australia;
- Unemployment Rates: SA and Australia;
- Male and Female Unemployment Rates: SA;
- Full and Part-Time Employment: SA;
- Monthly Hours Worked in SA and Australia;
- SA Merchandise Exports;
- Retail Trade in SA and Australia; and
- New Motor Vehicle Sales in SA and Australia.
Richard Blandy is an Adjunct Professor in the Business School at the University of South Australia.